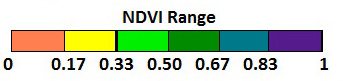
NDVI Ranges
Northern Study Area
|
1995

|
2005

|
2014

|
Looking at the NDVIs of Northern Virunga, we observe that there has been a substantial decrease in the greenness within the national park since 1995 to 2014. The presence of darker green indicates areas that are marginally forested. Yellow represents very scarce vegetation (0.166669-0.333334), and coral depicts very little vegetation (0.000001-0.166668). The black spots represent non-vegetated areas. We notice that the vegetation began to decline primarily along the river in 1995. By 2005, the decline in the vegetation occurred on the hill along the border of the park. The dark patch seen near the border is barren land which resulted from extensive subsistence agriculture. The yellow areas around it are crops, and the pinkish dots are the result of building homes. The 2014 NDVI shows that the entire region suffered a drastic reduction in the amount of vegetation greenness. In just a period of eight years (2005-2014), an incredibly fast deterioration took place in the vegetation cover. The NDVI values within the protected area dropped from 0.500000 to 0.333334. This means that the slightly forested areas became possibly shrublands or grasslands. The densely vegetated areas observed to the west of the park are completely absent in 2014. Instead, there is more mildly forested areas as well as less vegetation. Moreover, the coral spots to the left-side and right-side of Virunga are populated places. We can see that the forest around the settlements greatly diminished as the human population expanded over the years.
Central Study Area
|
1995

|
2005

|
2014

|
The NDVIs of Central Virunga shows us that the national park has been heavily deforested around the shore of Lake Edward. Deforestation is particularly severe in 2005 after the Second Congo War was officially over. Lake Edward is the black area in the middle of the image. The light and dark grey patches represent barren land; the clouds clustered over the Rwenzori Mountains (upper-right side) are depicted in a darker shade of grey. The 1995 Landsat image had some cloud cover over the lake (greyish blur), and also along the left-side of the shore (small black dots). The 2014 Landsat image also had cloud cover along the left-side of the shore and at the south end of the lake (dark grey spots). In 1995, we see that the area along the lake had low levels of vegetation, from scarce to very slight cover. After a period of five years, the vegetation cover deteriorated dramatically, about half of the national park was barren and had a very scarce vegetation. The area outside of the border also experienced a big shift from high levels of vegetation to very low levels vegetation or barren land. The 2014 NDVI, in contrast, shows a more uniform range of vegetation – from the top area to the head of the lake, the protected area seems to be turning into a region mainly composed of shrublands and grasslands (0.000001 - 0.333334). The areas that were previously barren and poorly vegetated in 2005 have developed some vegetation over the course of the years. This could be interpreted as a sign of a possible recovery of vegetation. However, given the instability of the country and the conflicts that it currently faces it is highly unlikely.
Southern Study Area
|
1987

|
2005

|
2014

|
In Southern Virunga, the Virunga Mountains have lost most of their highly dense forested areas. The volcanoes located to the east of the national park show the most vegetation decline between 1987 and 2014. Mount Nyamuragira and Mount Nyiragongo were both active when the ETM+ images were taken in 2005 and 2014. The 2014 Landsat image had cloud cover over the Virunga Mountains (displayed as dark spots), and haze was present on the upper side of the region. The decline in the vegetation, within the lower left portion of the region, is mainly due to the volcanic activity that takes place almost every year. The black trails seen near the volcanoes are recently dried lava flows. The coral trails were at some point lava flows but now they are slowly being recolonized by vegetation. The yellow trails show the succession of vegetation over the once barren land. To the southeast of the Virunga Mountains, the deep forest experienced a massive loss of tree cover due to the high population growth rate, and the influx of refugees from Rwanda. The concentration of people could explain the deforestation of the area since the displaced people most likely relied on the natural resources to survive. Most of the forest have been cleared in order to create more available space for agriculture and grazing. Farmers have turned great part of the volcanic areas into arable land given that they make rich agricultural lands. The soil of volcanoes are rich in soil minerals and high in nutrient content, as opposed to the nutrient poor tropical forest soils. As a result, the farmers are threatening to further reduce the habitat range of the critically endangered silverback mountain gorilla.
Change Detection Analysis
|
Northern Study Area, 1995 to 2005

|
Northern Study Area, 2005 to 2014

|
|
Central Study Area, 1995 to 2005

|
Central Study Area, 2005 to 2014

|
|
Southern Study Area, 1987 to 1995

|
Southern Study Area, 1987 to 2014

|
The images above support the data indicating major shifts in the NDVI results from the northern, central and southern Virunga region. While there are some trends of positive growth to be found in portions of the images, there is an overall trend toward negative change in either a decent percent of the image or a majority of the image in many cases. Given that Virunga is Africa's oldest national park, as well as a World Heritage Site, and the decrease in vegetation cover over the landscape raises a lot of questions. The believed culprits, as well as the methodology in these conclusions and solutions to these issues can be further addressed in the Discussion portion of the site.
